 What are Fractals? In addition to being really cool pictures/videos to look at, fractals are mathematical sets that demonstrate a repeating pattern at every scale. Each scale can also be almost the same as other ones. They may not be exactly the same, but they are the same type of structure. Although a fractal could also include a design that repeats itself. Fractals have what's called a fractal dimension. This is not easy to explain but here goes. When you double the edge lengths of a polygon, the area of the polygon increases by four times. If the radius of a sphere is doubled, the area volume by 8 times. When side lengths of a fractal are doubled, the power at which volume is increased is not necessarily an integer. That power is called the fractal dimension. So a fractal dimension is essentially a ratio that can indicate how detail in the fractal pattern changes with the scale at which it is measured or looked at. The closer you look at a fractal, the amount of detail changes. That amount depends on the fractal dimension. The higher the fractal dimension, the more detail/ the fractal gains when side lengths are increased. Knowing that, you can imagine what happens when the fractal dimension is decreased. Why did you choose fractals for your final project? I chose fractals mainly because they're cool to look at and it seemed very interesting to me how they can continue and have the patterns they have. The fact that this is mathematically possible is intriguing to me. What are some real life applications of fractals? Fractals are found in many places in nature, including certain plants, sea shells, lightning, and even in human blood vessels and lungs. Humans are using fractals to create things as well. Currently, engineers are working on using fractals to solve the problem of liquid transport. They're being designed into computers to distribute coolant throughout them. A brief history of fractals? Humans began to partially understand fractals in the 17th century. Gottfried Leibniz initially made some discoveries that weren't far from accurate. It wasn't until 1872 that Karl Weierstrass presented the first definition of a function with a graph that would today be considered fractal. In 1883, Cantor sets were invented, which are now recognized as fractals as well. "self-inverse" fractals were also introduced around that time period. Modern computer technology has given us a helping hand in understanding fractals. This is something these people didn't have when this was discovered. Little did they know these things could create some sweet images. 
0 Comments
 I used two of Archimedes' spirals to create a visual "background" of sorts. I just manipulated a couple of constants along with the slider speed to create a sort of ambiance in the background for the other equation. For the other equation it got a little more complicated. r=a*sin(b/ctheta) was the equation I used. I then let the slider go and it did all sorts of fun things. The combination of the three really makes for a show. This allowed me to better understand the effect adding certain constants can have on a graph. It's good to know how you can manipulate certain aspects of the graph by adding certain numbers or constants in certain spots.  SSA can sometimes be ambiguous because on some occasions, you can get multiple triangles when solving. You can't use the law of Sines at all times because you would only be finding one solution when a triangle can have two solutions or none. Although it would help you find out that there was no solution. 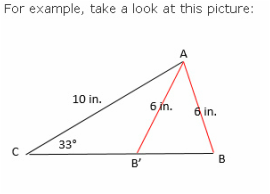 This picture provides a good example for this theory. The side lengths that are 6 inches long are given. Now, using the law of sines you solve for the imaginary line "h" That would be directly in between those two lines, and would make the triangle a right triangle. You must first solve for h because that tells you whether or not you have solutions. If the given value for c is greater than h but less than b, you have two solutions because you can create two triangles. If the given value is the same as h, you have one solution and a right triangle. If the given value is less than h, you have one obtuse answer because you need a longer side length to create a second, acute triangle. If c is greater than b, then you can only have one solution, because the second one wouldn't fit in the other side of the triangle. 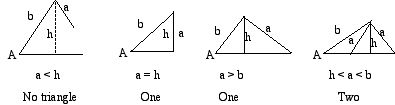 Step 1: Expand the tan^2x to sin^2x / cos^2x Step 2: Expand the 1 to cos^2x / cos^2x. This can be done because cos^2x / cos^2x = 1 for all real numbers, or fake numbers, who knows? Step 3: Group the bottom sin^2x / cos^2x and cos^2x / cos^2x to make it into (sin^2x + cos^2x) / cos^2x. Step 4: Change (sin^2x + cos^2x) to 1 because (sin^2x + cos^2x) = 1 with the Pythagorean identity. Step 5: Cancel out the top cos^2x with the bottom cos^2x to leave just sin^2x. From this project, I learned valuable skills on working through a trig identity. I learned all of the basic identities in greater depth. This also helped me learn how to work through this kind of identity and do it again in the future. 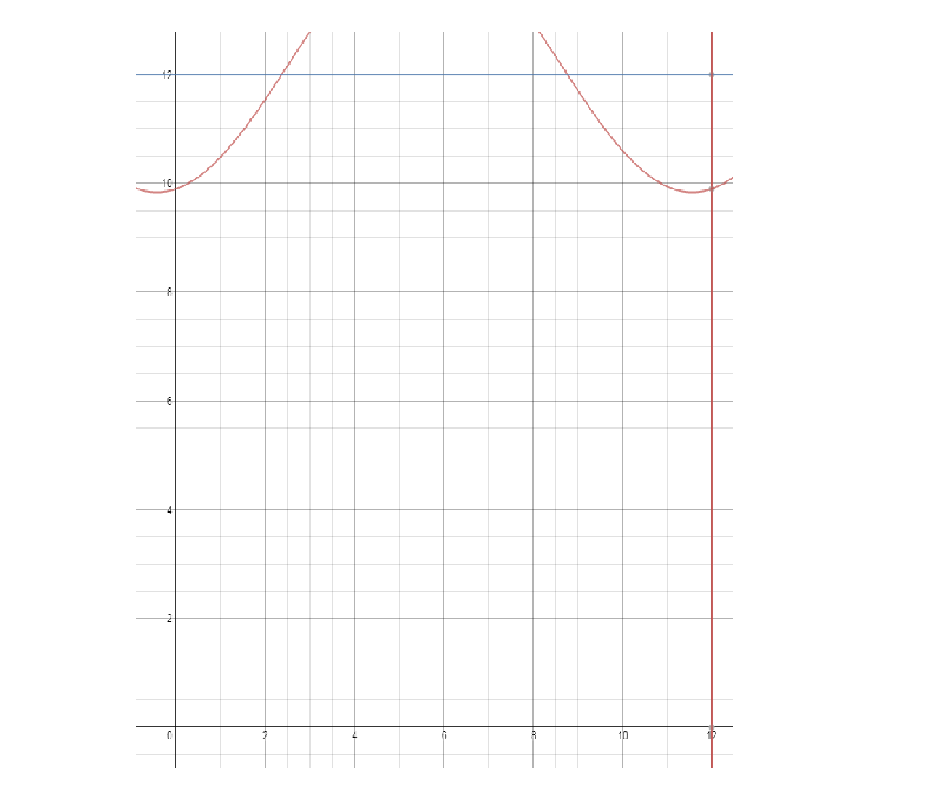
The way I went about figuring out the Cress and Little problem was graphing. I graphed the function on Desmos and I then graphed Y=12. When Y equals the amount of daylight hours per day in a month, you know that any month with an average daylight hour per day rate is more than half of the day, or 12 hours. I then graphed a line of x=12, just so you could see where it ends. If you count the places where the red graph is above the blue line, you count six. I am unsure if Cress said he wanted more than half of the year with 12 hours of sunshine, or if he said he wanted half. If he wanted half, he should move there. Had he wanted at least seven months, he should not have moved as that is more than half and he doesn't get it. The equation is : h=2.415sin[pi/6(t-2.5670]+12.25 
From the feeling trig functions activity, I learned a lot. I learned that you could graph trig functions using the unit circle. I thought you just had to use an equation and just go from there, but that is not the case. I don't know if this helped me make connections between graphs of trig functions and the unit circle because I don't think I even thought about relating the two at all while doing this. The two things were completely separate thoughts so I never really made any connections. I think my big takeaway was memorizing the lengths of the standard 30/60/90 and 45/45/90 triangles, even though that may have been something I should have memorized earlier. Not having the teacher there to confirm made it quite a bit harder because I am pretty indecisive by nature and when being paired with someone else who is also very indecisive it was difficult to come up with a concrete answer that we were confident in. However, we ended up doing well. 
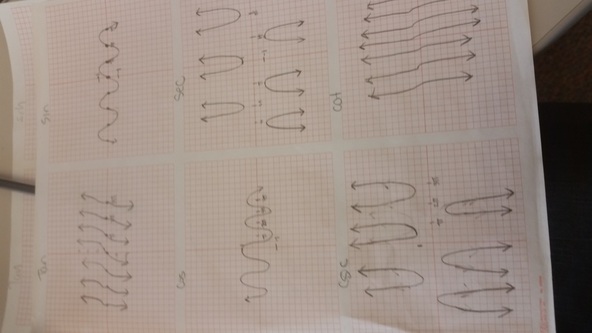
Period and Amplitude Tan Graph: There is no amplitude, the graphs go on forever in both directions. The period of the graph is pi. Cotangent Graph: Amplitude and period are the same as tangent. Cosine Graph: The amplitude is one and the period is 2pi. Secant Graph: The amplitude is none because they go on forever. Period is 2pi. Sine Graph: Amplitude is 1 and period is 2pi. Cosecant Graph: Cosecant has no amplitude, it goes on forever. Period is 2pi. Compare and Contrast The cosine and sine graphs look the same except the sine graph passes through (0, 0) and cosine has a point somewhere on the y-axis. Vertical Asymptote For tangent and cotangent the vertical asymptote is at the end of each cycle. Cosecant has a vertical asymptote at pi and repeats every pi units. Secant has a vertical asymptote at pi/2 and repeats every pi units. 
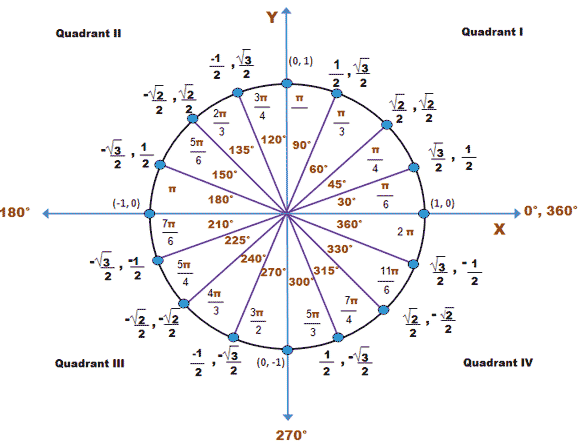
A radian is a unit of measurement on a circle that is equal to the radius. The formula for circumference of a circle is 2(pi)(r). On the unit circle, pi radians is one half the way around the circle. 2pi is the full circle. This is because the radius times pi is equal to half of the circumference of the circle. In terms of degrees, a radian is about 57.2958. The radian is if you took the length of the radius, put it on the outline of the circle, then created a triangle of sorts with those lengths. I prefer to use radians when doing things involving the unit circle or graphing the unit circle, but degrees are preferable when looking at arc length or other things because they are more natural to me.  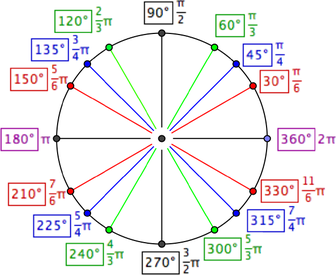 
PLUS Loans: As with other education loans, PLUS loans are funded directly by the federal government. But unlike traditional student loans, they have no maximum amounts and can be used to cover any education costs not covered by other financial aid. They have a fixed interest rate of 7.9 percent compounded monthly. Private Education Loans: As the name suggests, these loans are provided by private lenders and do not use government funding. Because of this, private education loans more closely resemble personal loans than student and parent loans.Your eligibility and interest rate depend on your credit history. Your interest rate is typically higher than with federally guaranteed education loans but lower than with other debts like credit card debt. Specific borrowing terms vary by lender. For the sake of this problem, let's say my loans have an interest rate of 9 percent compounded Payments are $150.06. Perkins Loans: Perkins Loans have a fixed interest rate of 5 percent. They are all subsidized, so the government pays any interest accrued while you’re in school and for a short period after you graduate. Because of their favorable terms, Perkins Loans are reserved for students who show exceptional financial need.These loans are funded by the government but disbursed by each individual college or university. The federal government distributes a limited amount of funds to each school, and the school determines which students to lend to. As with Stafford Loans, students can only borrow a certain amount through Perkins Loans. Eligible undergraduates may borrow up to $5,500 in Perkins Loans annually, for a total of $27,500.Graduates students may borrow up to $8,000 annually. The total cap is $60,000 and is based on both undergraduate and graduate Perkins Loans. I was able to calculate how long it would take to pay these loans off by using the equation A=p(1+(r/n)^nt. A represents how much the total cost is, p represents the initial loan taken out before interest, r represents the interest rate, n represents the number of times it compounds annually, and t represents the times the loan is taken out. You then divide what you get for A by the payment amount, and you have the amount of payments you need, which is equal to the months it takes. All of these are monthly payments, After doing calculations, I came up with these results PEL: Payments: 168 payments of $150.06 which gives a total of $25151.36. That means it would take 16 years to pay off. Perkins Loans: Payments: 107 payments of $212.13, which adds up to a total of $22,692,36. That means it would take around 9 years to pay off. PLUS loans: Payments: 185.2 payments of $120.22 dollars, which adds up to $22,261.57. That means it would take around 16 years to pay off. Here are my equations 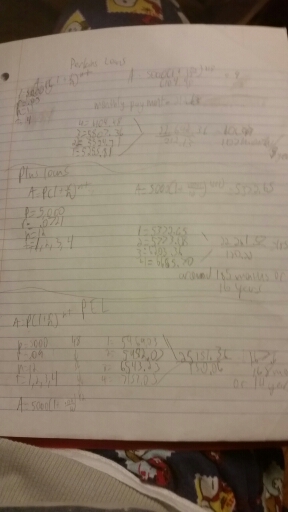

What is the Golden Ratio? Aside from a special irrational number approximately equal to 1.618, The Golden Ratio is a ratio that in order for two numbers to fit it, there has to be an exact balance. The exact balance required is when A/B is the same as (A+B)/A. If A+B is one hundred, the percentages come out to A=61.8 and B=38.2. The picture below is a good representation. The Golden Ratio is represented by the Greek letter phi. 
Why did you choose the Golden Ratio for your final project? I chose the Golden Ratio for many reasons. A few of which are a cool name, curiosity, the real life applications, and the fact that there is still quite a bit of interest on the topic even though it came to be a very long time ago. Where in real life does the Golden Ratio apply? The Golden ratio has been used for many things, the design of books was based on the Golden Ration for a very long time. The pages were golden rectangles. In an era around 1500s-1700s, almost all books were made with a page length ratio of 2:3, 1:Square root of 3. Salvador Dali also used a Golden Rectangle for the canvas of his famous "The Sacrament of the Last Summer" 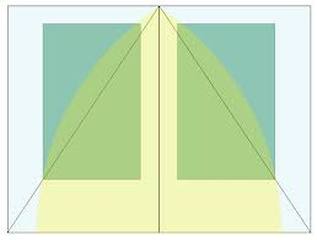
A brief history of the Golden Ratio? The Golden Ratio was originally defined in around 300 B.C. by Euclid. It was noted that famous pieces of art and architecture such as the Parthenon followed this ratio. Around 1200, Fibonacci came up with his sequence, which is related asymptotically to the Golden Ratio. Zoom forward to the 20th century, and it is given the Greek symbol Phi to represent it. Many twentieth century architects then planned their buildings according to this ratio. It has also been observed to occur naturally. Adolf Zeising observed it as a Ratio "in which is contained the ground-principle of all formative striving for beauty and completeness in the realms of both nature and art, and which permeates, as a paramount spiritual ideal, all structures, forms and proportions, whether cosmic or individual, organic or inorganic, acoustic or optical; which finds its fullest realization, however, in the human form." This means it applies to a lot of things. 
| ArchivesMarch 2015 AuthorWrite something about yourself. No need to be fancy, just an overview. Categories |
 RSS Feed