A zero is a factor times negative one. If you set a factor equal to zero and solve, you get your zero. The degree of a polynomial tells us how many zeros it has. It does not always tell us the factors because sometimes a zero repeats, thus only giving us one factor for two zeros.
0 Comments
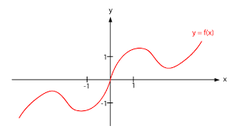
Part 1: The GIF below shows the secant line used to find the average rate of change between the fixed point (2,2) and another point on the curve f(x)=.5x2. Using desmos, recreate this GIF, and answer the following questions in a blog post. y=kx-1 1)How does the slope of your secant line (your average rate of change) change as your roaming point changes? How is this related to the location of your roaming point on the curve? As the value of k increases, the slope increases. as the x value of the location of the roaming point, slope also increases. When K increases, the x and y value of the roaming point increase. 2)When is the slope of your secant line closest to the rate of change at the point (2,2)? When k equals 1.5 3)Is your average rate of change ever 0? If so, where does this occur? No, as long as x is increasing (which it is), your rate of change will always be a positive number in this function. It has to mathematically. Part 2: 1)How does the slope of your secant line (your average rate of change) change as your roaming point changes? How is this related to the location of your roaming point on the curve? The answer here is the same as in part 1. The rule is the same, just with a negative reflection. As k increases, so does the slope. 3)Is your average rate of change ever 0? If so, where does this occur? No, the graph maintains either a positive or negative rate of change. http://goo.gl/tHQxP9 Blog post: Create a new post titled “Piecewise Functions”. Please insert a screenshot of graph #4. Describe in your post how you wrote a function to describe the behavior of the graph and how the domain and range changed from each individual function. When writing this function I had to consider domain. It was split up into (-infinity,0), (0,2), and (2,infinity). For the (-infinity,0) I knew it was linear so I started with that. I also knew it was negative and i saw where my Y intercept was. Observing the slope was the third part of the puzzle. For the (0,2) I noticed that it looked like a square root function and was. Seeing the Y intercept and slope (rate of change) in the function, it led me to educated guess and check. The same goes for (2,infinity) except I didn't have a Y intercept to work with. All I knew is that it would be negative. The domain was split up into the three functions, but the range was different. Starting from right to left, the ranges were (2,infinity),(0,2), and (0,infinity) 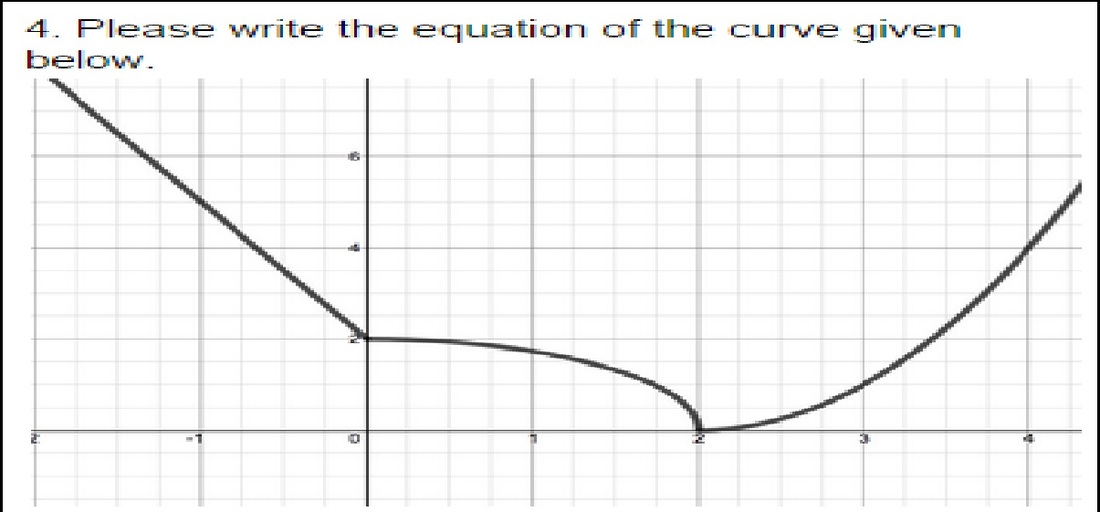 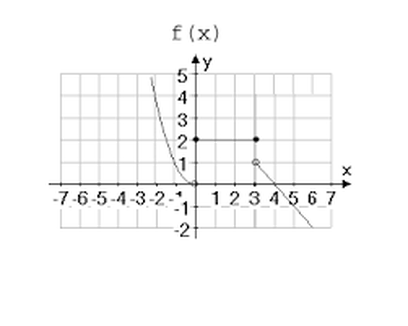 Here is another piece wise function that I thought illustrated what it is well.
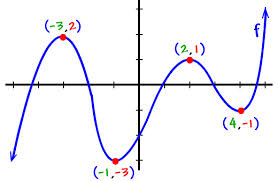
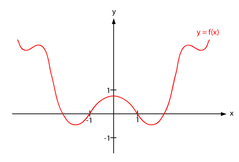
In this activity, I learned quite a bit about the math behind even and odd functions. It has more to it than just the highest power of x. Even and odd functions are similar in that proving them to be one or the other algebraically is almost the same. The only difference is a negative sign. Proving functions are negative is -f(x)=f(-x). The positive version is f(x)=f(-x). The functions themselves are similar because they have symmetry. The even functions are completely symmetrical while the odd functions are sort of symmetrical. Even functions are (x,y) and (-x,y) while negative functions are (x,y) and (-x,-y). I'm not sure it's correct to say they are "kind of" symmetrical, but the points on each side have a correlation with the points on the other side in an odd function. That's another thing both functions have in common; the points on one side have a correlation with the points on the other side. Even Odd
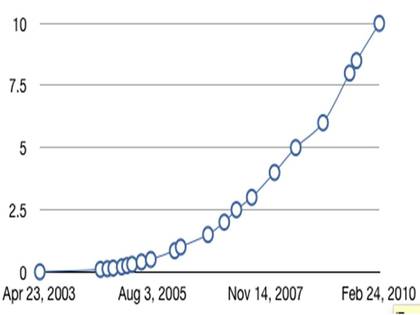
What type of function does this data appear to follow? The data appears to follow an exponential function. Please enter some estimated points from the graph into Desmos.com or Geogbra.org to determine an estimated mathematical model for this function. Y=1.9^(.9x-3.3)+-.1 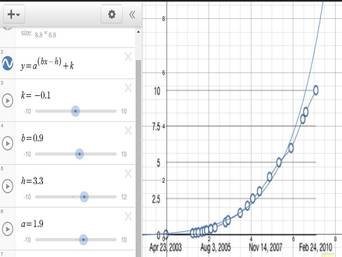
What is the domain of this function?
The domain is all real numbers. What is the range of this function? The range is x>0Please read the following article and comment on the future shape of your mathematical model: It will continue to increase exponentially as new products are released. How does this affect your predictions of domain and range of the function? Is there a problem with trying to extend a set of data points to continuous functions? Why or why not? This leads me to the conclusion that the range could fall into the negative and and the domain would not continue to increase as expected. You cannot extend this information for longer periods of time because the graph cannot always be properly predicted. A. What do you need to know to make an equation for the flight of the ball? You need certain checkpoints (found in the picture), a line of best fit, and try to find a trend in distance between each ball. B. Will the shot go in? According to my image and equation, the shot will go in. This is j 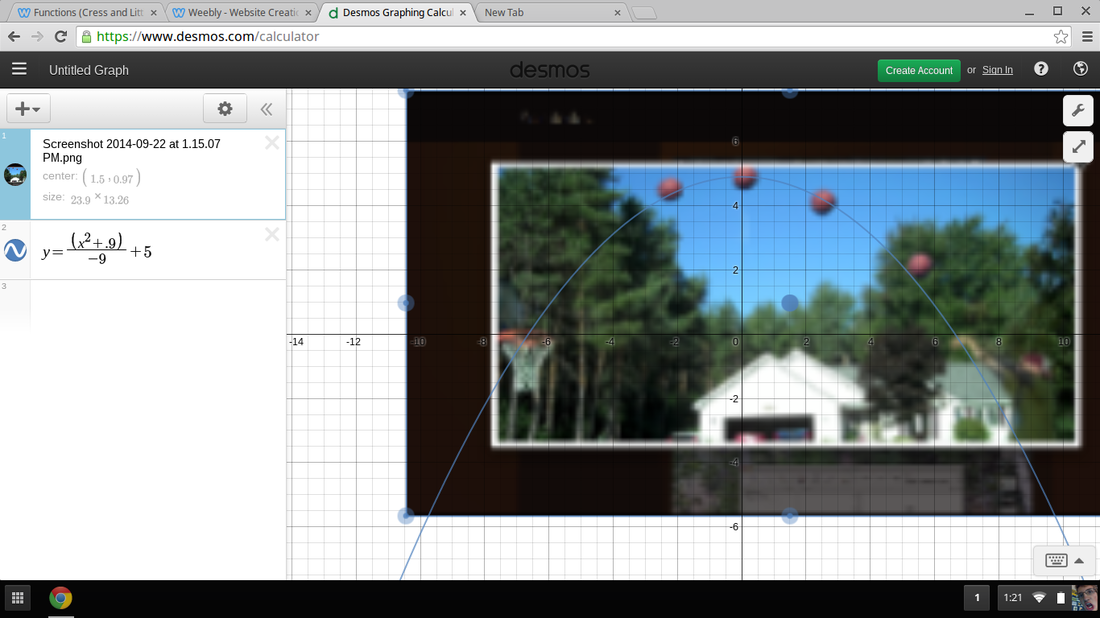
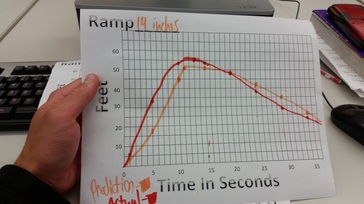
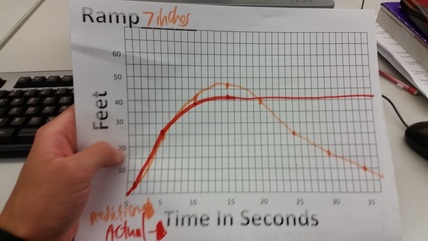
A. How close was your prediction to the actual graph? If your graphs were different then why were they different? What initial reasoning led you to your original graph and why was it different? MY first graph was pretty far off. I had the wrong idea when it came to finding out that the skateboard would go backwards as fast as it did. My reasoning was that the speeding up would be a gradual process and that it wouldn't happen as quickly as it did. This caused the slope early on in my function to be too low and continue for too long. B. What do the zeros of your graph represent? Zeros represent when the skateboard isn't moving. C. How do the three graphs compare in terms of zeros, maximums and minimums? What's similar and different and why? They all start at zero. The higher the ramp, the higher the maximum and the longer it takes to get back to zero. None of them have minimums lower than zero because you can't go a negative distance. The higher the ramp, the greater the accelerating force, which makes the skateboard go faster, which causes the trends above. D. Consider the slopes of the graphs. When is the graph rising the fastest and what does it mean? When is it falling the fastest and what does it mean? The graph is rising the fastest shortly after the skateboard gets off the ramp. This also happens to be the time the slope is the highest. This means the object gains its maximum velocity shortly after being accelerated. The farther you get from the maximum, the faster the slope goes down. This is because it is gathering momentum from the hill it is going down backwards. E. Please be sure to add an image of your graph(s) and contextualize the blog post for your readers. https://drive.google.com/folderview?id=0B9eadWLsDcAqS0VRQ1ZuMFVweW8&usp=sharing 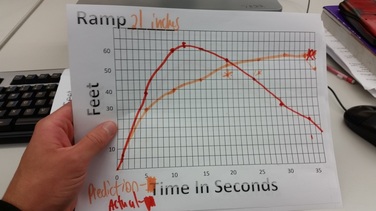
A. He raised the flag at a constant rate
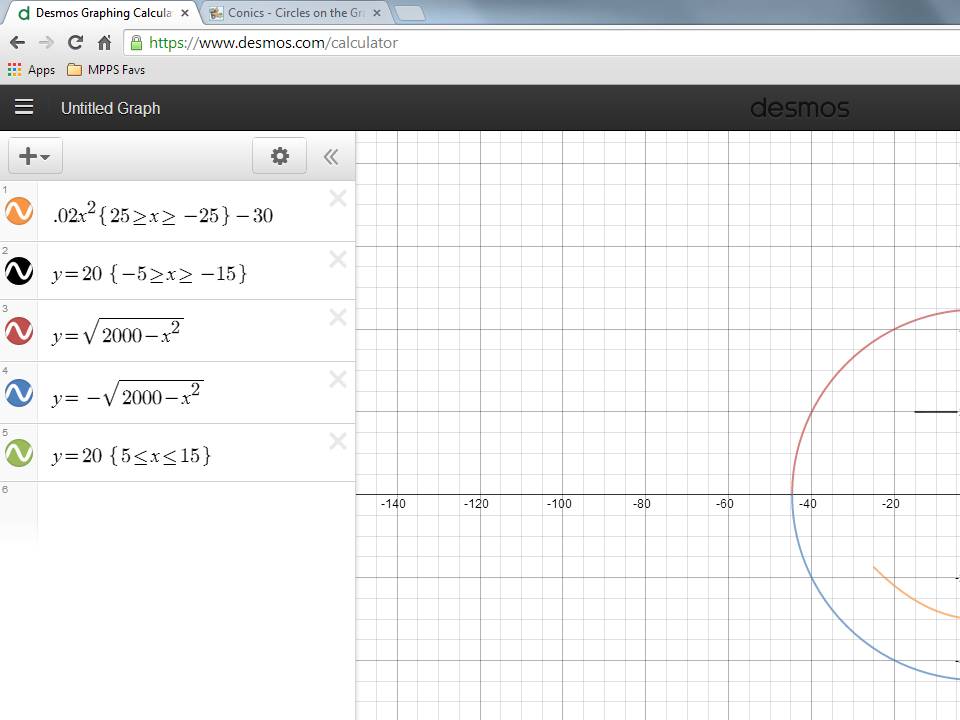
B. He got less efficient as time went on - Most realistic because after a little bit of pulling his arms would probably get tired and he would slow down. C. His speed of raising changed back and forth quite often D. He got more efficient as time went on E. He sped up rapidly then slowed back down F. The flag went up instantly - Least realistic because it isn't humanly possible to pull a flag that far instanly For the eyes I used constant functions at 20 on the Y axis. I used brackets and the greater than or less than signs to create a line segment rather than a line that continues infinitely. By setting the line as (#>x>#), the line will remain in between those two numbers. For the mouth, I used a quadratic function. By decreasing the coefficient of x, I was able to make the parabola wider than the standard y=x^2. I had to do the same thing for this as I did with the eyes in terms of keeping the length of the segment limited. I changed the Y value to lower it as well. I used a conic to make the outline of the head. I changed the b value to make the circle either more wide or narrow. 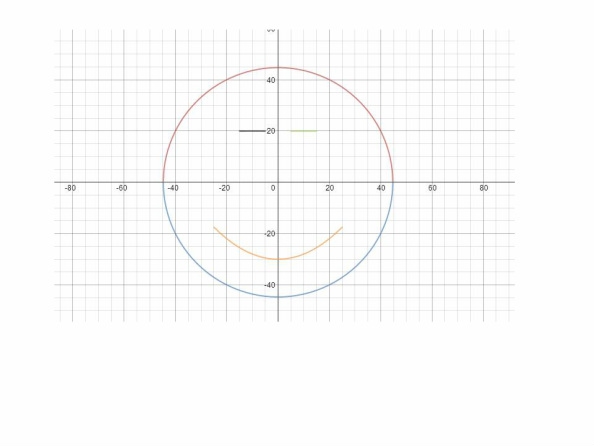 | ArchivesMarch 2015 AuthorWrite something about yourself. No need to be fancy, just an overview. Categories |
 RSS Feed