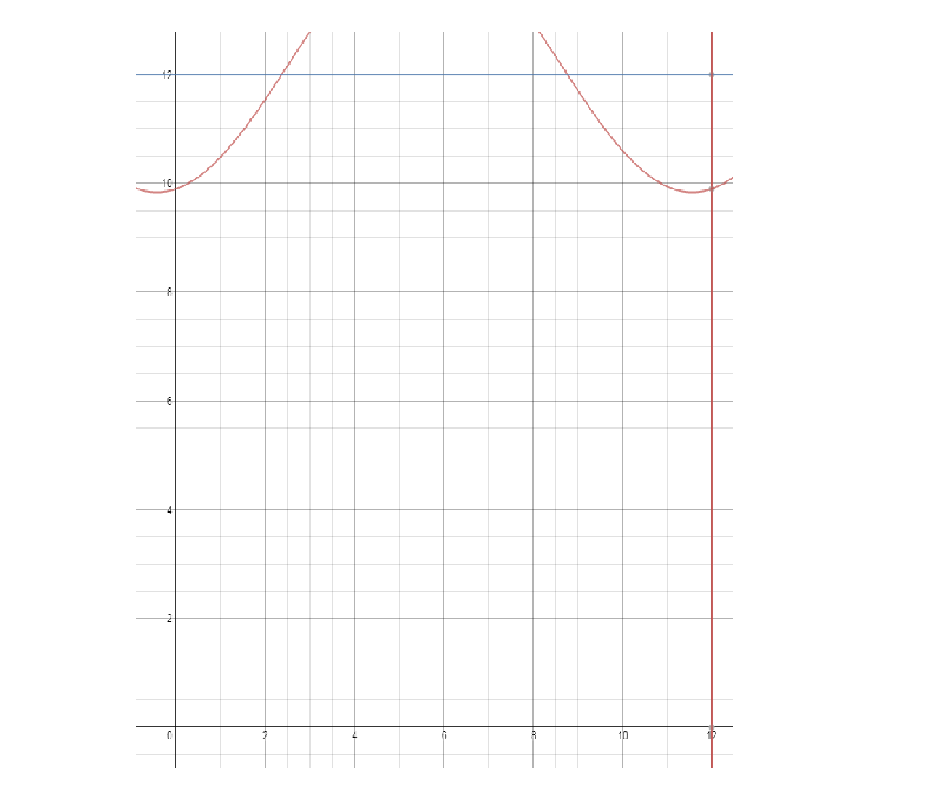
The way I went about figuring out the Cress and Little problem was graphing. I graphed the function on Desmos and I then graphed Y=12. When Y equals the amount of daylight hours per day in a month, you know that any month with an average daylight hour per day rate is more than half of the day, or 12 hours. I then graphed a line of x=12, just so you could see where it ends. If you count the places where the red graph is above the blue line, you count six. I am unsure if Cress said he wanted more than half of the year with 12 hours of sunshine, or if he said he wanted half. If he wanted half, he should move there. Had he wanted at least seven months, he should not have moved as that is more than half and he doesn't get it. The equation is : h=2.415sin[pi/6(t-2.5670]+12.25 
0 Comments
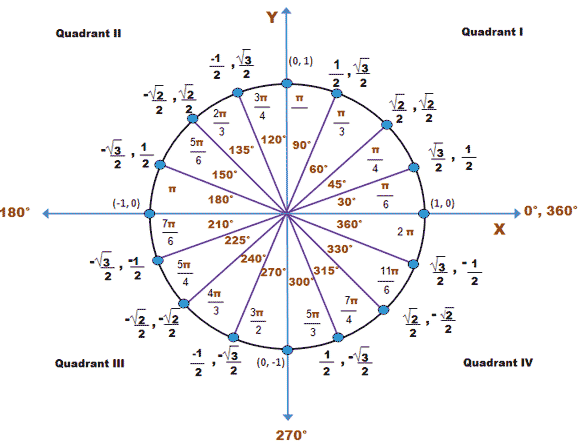
From the feeling trig functions activity, I learned a lot. I learned that you could graph trig functions using the unit circle. I thought you just had to use an equation and just go from there, but that is not the case. I don't know if this helped me make connections between graphs of trig functions and the unit circle because I don't think I even thought about relating the two at all while doing this. The two things were completely separate thoughts so I never really made any connections. I think my big takeaway was memorizing the lengths of the standard 30/60/90 and 45/45/90 triangles, even though that may have been something I should have memorized earlier. Not having the teacher there to confirm made it quite a bit harder because I am pretty indecisive by nature and when being paired with someone else who is also very indecisive it was difficult to come up with a concrete answer that we were confident in. However, we ended up doing well. 
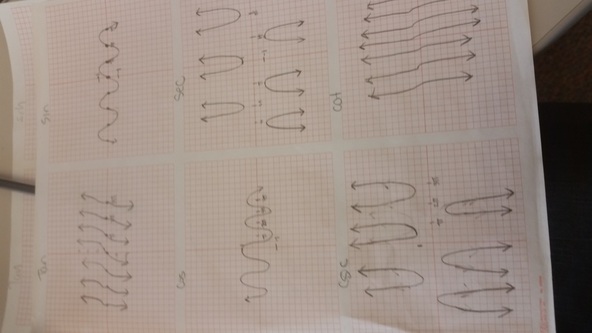
Period and Amplitude Tan Graph: There is no amplitude, the graphs go on forever in both directions. The period of the graph is pi. Cotangent Graph: Amplitude and period are the same as tangent. Cosine Graph: The amplitude is one and the period is 2pi. Secant Graph: The amplitude is none because they go on forever. Period is 2pi. Sine Graph: Amplitude is 1 and period is 2pi. Cosecant Graph: Cosecant has no amplitude, it goes on forever. Period is 2pi. Compare and Contrast The cosine and sine graphs look the same except the sine graph passes through (0, 0) and cosine has a point somewhere on the y-axis. Vertical Asymptote For tangent and cotangent the vertical asymptote is at the end of each cycle. Cosecant has a vertical asymptote at pi and repeats every pi units. Secant has a vertical asymptote at pi/2 and repeats every pi units. 
| ArchivesMarch 2015 AuthorWrite something about yourself. No need to be fancy, just an overview. Categories |
 RSS Feed